Overview
In the first half of this article, we introduce useful commands and tools for memory optimization in Unreal Engine (UE). The second half explains how to use these commands and tools to optimize memory in UE.
With numerous reference articles and videos provided, combining them with this article will deepen your understanding.
Environment
- Unreal Engine 5.4
Main Content
Purpose of Memory Optimization
- Performance Improvement
Efficient memory management improves frame rates and overall game performance. - Resolve Memory Shortage Crashes
- Reduce Load Times
Optimized textures and assets lead to shorter load times.
Useful UE Memory Management Commands and Tools
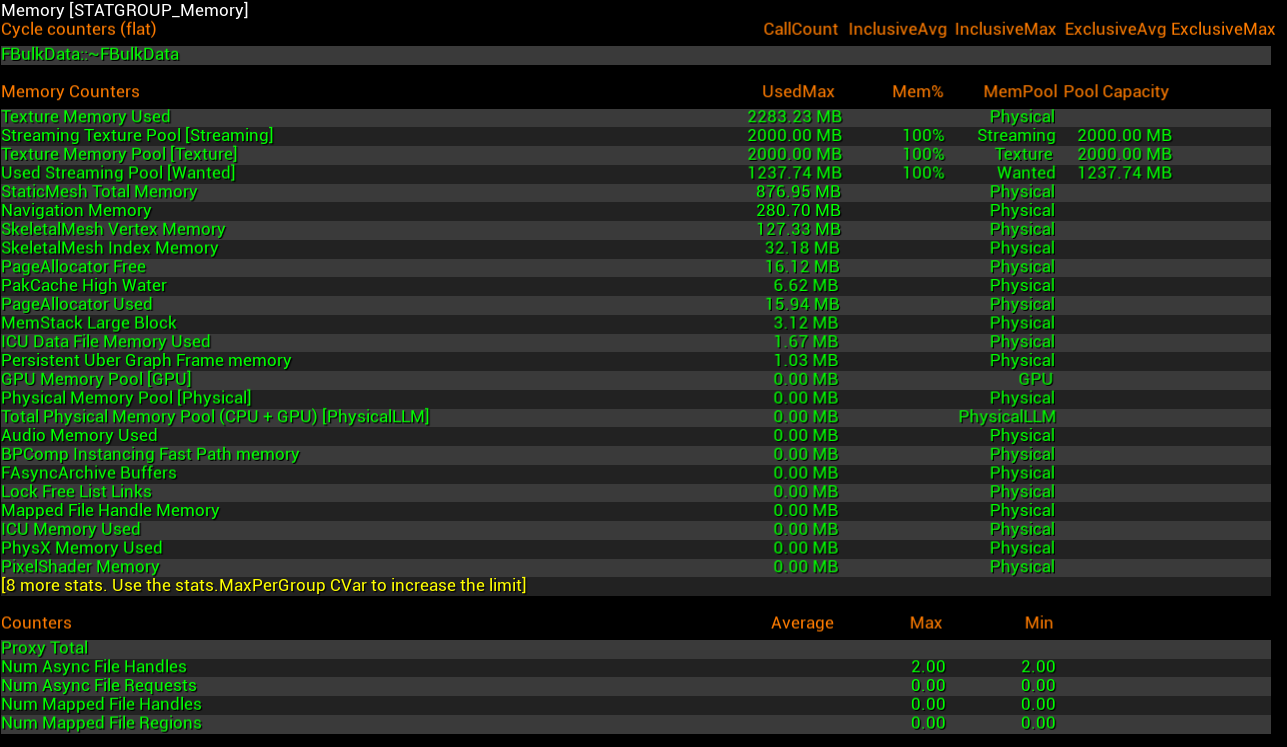
stat memory
- Command:
stat memory
Displays current memory usage categorized by type on the game screen.
Memreport
- Command:
memreport -full
Saves a memory report as a dump file. - Command:
memreport -log
Displays a memory report in the log.
Memreport References:
Qiita: Investigating Memory Leak Causes with Memreport (ja)
Memreport Examples
-
Displaying Total Memory Usage
- Search for "Physical Memory" in the dump file to locate this information.

- Search for "Physical Memory" in the dump file to locate this information.
-
Listing Textures by Memory Usage (Descending Order)
- Search for "listtextures" in the dump file to view this data.

- Search for "listtextures" in the dump file to view this data.
Object List Commands
- Command:
obj list
Lists currently existing objects. - Command:
obj list name=
Searches for objects by name. - Command:
obj refs name=
Displays references for an object by name.
Obj List Reference Articles:
Obj List look like this image below

Garbage Collection (GC) Commands
- Command:
obj gc
Executes garbage collection once. - Command:
gc.ForceCollectGarbageEveryFrame 1
Forces garbage collection every frame. - Command:
gc.ForceCollectGarbageEveryFrame 0
Stops forced garbage collection every frame.
Assets can be released or references checked through garbage collection (GC).
Running forced GC every frame may cause the game to run slowly, so it is recommended to avoid using this outside of investigation purposes.
GC References:
What is GC?: Official Documentation: Unreal Object Handling in Unreal Engine
Low-Level Memory Tracker (LLM)
- Command:
stat llm
Tracks memory usage using Low-Level Memory Tracker.
For more details, please refer to the references below.
LLM References:
Official Documentation: Low-Level Memory Tracker
[UE4] Using LLM (Low Level Memory Tracker) for Memory Tracking (ja)
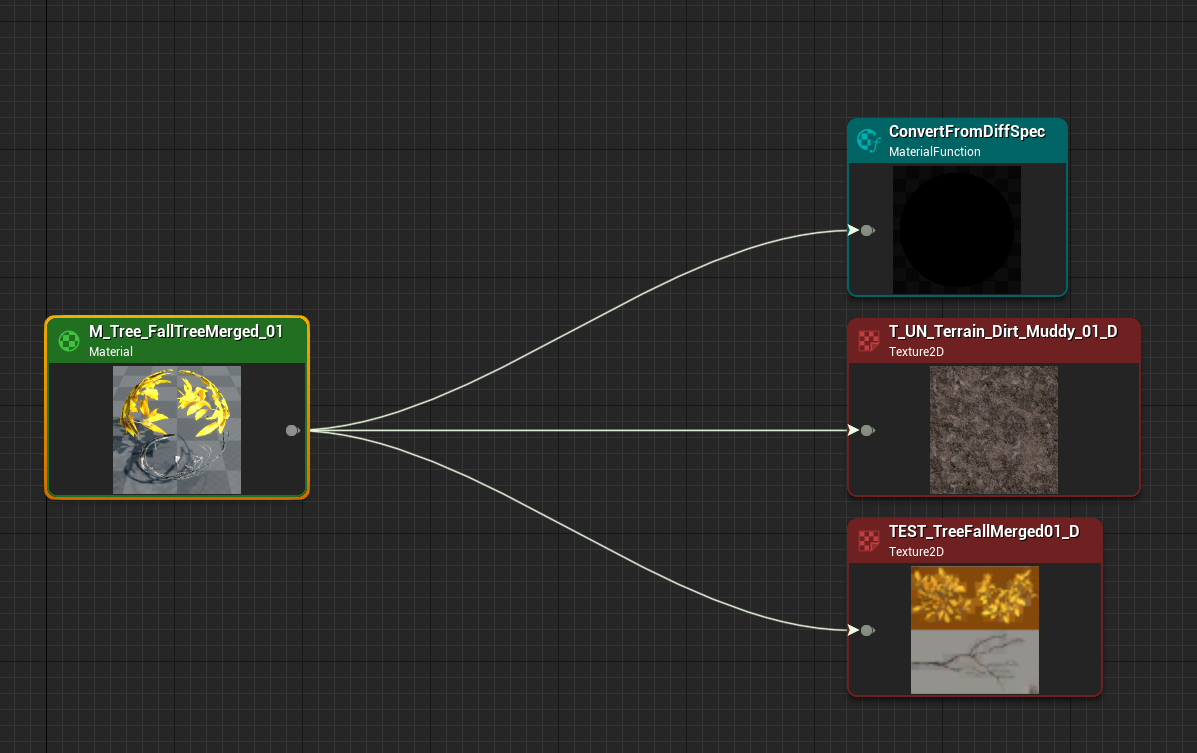
Reference Viewer
This tool shows the graph of assets that are referenced by or reference other assets. You can use it by right-clicking on an asset in UE and selecting "Reference Viewer". It is useful for investigating when assets that should not be loaded are unexpectedly loaded.
Size Map
Right-click an asset in UE -> "Size Map" -> Select "Memory" in the top right.
Shows the total memory usage of all referenced assets.
Size Map Reference:
Video: How To Optimise Memory Usage In Your Unreal Engine 5 Game

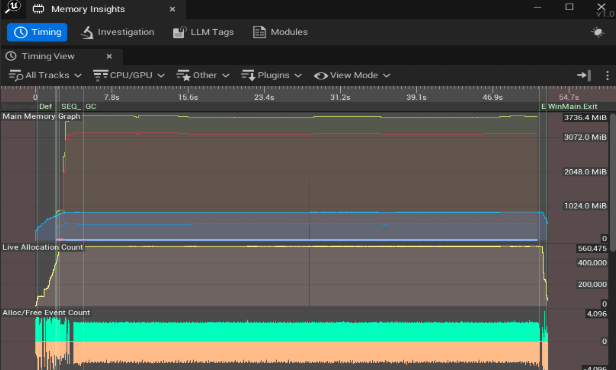
Memory Insight
- A tool for analyzing memory allocation and release over time. example: Time A -> Time B memory allocated 123.456MB
Memory Insight Reference:
Qiita: Using UE4 Memory Insights for Memory Tracking (ja)
Official Documentation: Memory Insights
Memory Insight Example for Investigating Memory Leaks Video (34:38): Maximizing Your Game's Performance in Unreal Engine | Unreal Fest 2022
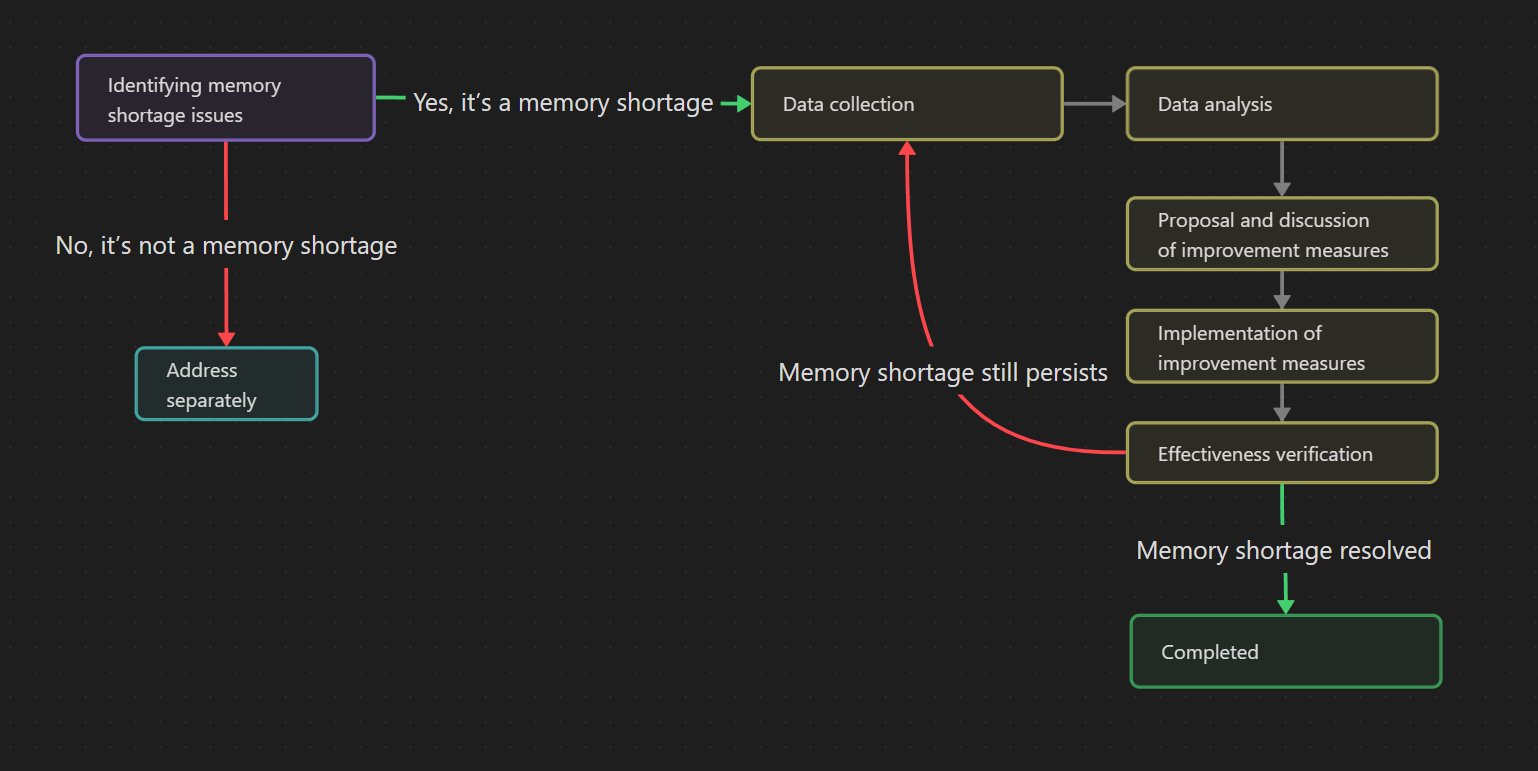
Memory Investigation and Optimization Approach
The memory optimization flow generally follows the steps below:
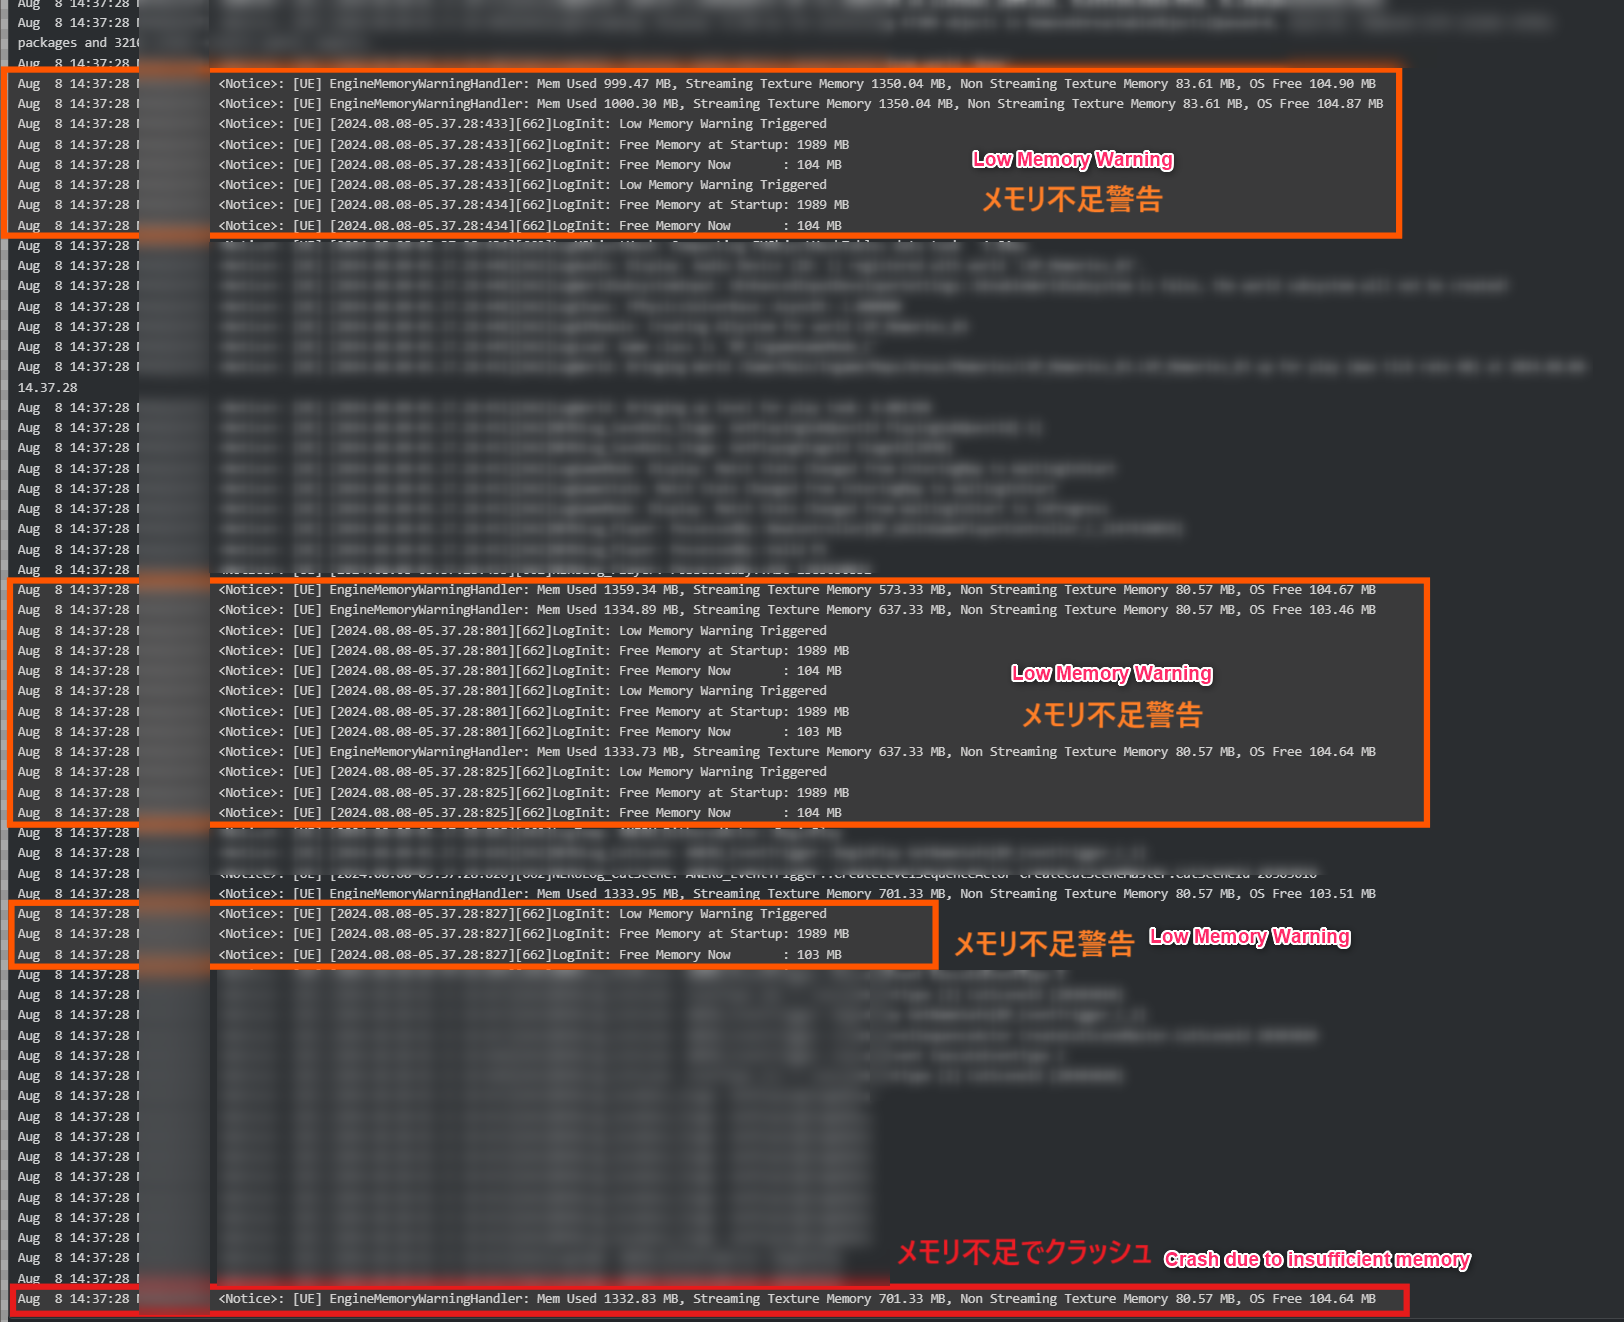
Identify Memory Issues
Look for crash logs or memory warnings.
Collect Data
Using tools such as stat memory, memreport, Memory Insight, and other profilers outside of UE to investigate memory usage:
- Always investigate on real devices or packaged versions.
- In PIE mode, preloaded cache and background operations can affect measurements, making accurate results difficult.
- Memory usage varies by device.
Checking Total Memory Usage
To check the overall memory usage, it's safe to ensure that at least 500MB of physical memory is available.
Use memreport -full to check:
- Part of Memreport: Displays overall memory usage.
- Search for "Physical Memory" in the dump file to find this information.

- Search for "Physical Memory" in the dump file to find this information.
Checking Texture Memory Usage
You can check the texture memory usage by displaying the listtextures nonvt report (sorted by size).
Use memreport -full to check:
- Part of Memreport: Displays textures in descending order of memory usage.
- Search for "listtextures" in the dump file to find this information.

- Search for "listtextures" in the dump file to find this information.
Analyze Data
Identify high memory usage resources (e.g., textures, materials).
Investigating Unnecessary or Overly Large Assets
To investigate whether unnecessary assets have been loaded:
Use the command obj list name= to search for the asset by name and check whether it has been loaded.
Example: obj list name=T_SomeTexture
Use the command obj refs name= to display which objects are referencing the given asset, helping you identify why it was loaded.
Example: obj refs name=T_SomeTexture
Additionally, you can use the Reference Viewer to further track the origin of references and investigate how hard references are being made.
For more about Hard and Soft References:
Propose Improvement measures
- Delete unnecessary assets or prevent them from being loaded.
- Reduce the resolution of large textures or adjust compression settings.
- Other adjustments based on data analysis:
- Example: In mobile games, adjusting lighting settings can reduce memory usage.
Reference on Compression Formats:
[UE5] Image Compression Formats (ja)
Texture Optimization:
Video: Optimizing textures for Mobile in Unreal Engine 5 Basic Mipmap Settings in UE5 (ja)
Implementation of improvement measures
Fix problematic assets or prevent them from being loaded.
- Delete unnecessary assets:
- Remove hard references.
- Free assets that are no longer in use:
- Change hard references to soft references, and set them to
nullptrwhen they should be released, so they will be freed during the next GC execution.
- Change hard references to soft references, and set them to
- Reduce the resolution of large textures or adjust compression settings.
- Other adjustments as needed.
Verification
Compare memory usage before and after optimization by memreport.
How to check if problematic assets are no longer loaded
You can force garbage collection using the commands gc.ForceCollectGarbageEveryFrame 1 or obj gc.
When an asset is no longer referenced (set nullptr for soft references), you can force garbage collection at that point. Additionally, use obj list name= to check if the asset is still present. If it is still loaded, it means there are remaining references, and you should perform data analysis again.
Comparing Memory Usage Changes
Use the command memreport -full or memreport -log to check the overall memory usage and compare before and after implementing optimizations or adjustments.
Key Takeaways from Memory Optimization
- Develop habits to prevent memory leaks, such as ensuring assets are properly released.
- Be cautious of hard references that can load all referenced objects.
- Use soft references where applicable.
- Continuously monitor memory usage for improvements.
Summary
- Importance of Memory Optimization
Aims to improve performance, reduce load times, and prevent memory crashes. - Useful Commands and Tools
stat memorymemreport -log,memreport -fullobj list,obj refs name=obj gc,gc.ForceCollectGarbageEveryFrame- LLM
- Reference Viewer
- Size Map
- Memory Insight
- Optimization Process
Identify issues, collect data, analyze, propose improvements, implement fixes, and verify.
Examples of Improvement Measures
- Deleting unnecessary assets or preventing them from being loaded
- Reducing the resolution of large textures or adjusting compression settings
- Other measures (varying based on data analysis)
I hope this article helps when you experience crashes due to memory shortages.
If there are any mistakes, please let me know in the comments, and I will correct them.
References
- Qiita: Investigating Memory Leak Causes with Memreport (ja)
- Ari's Unreal Engine Notes: Debugging Memory Leaks
- [UE4] Using Memreport Effectively (ja)
- [UE4] Object Analysis Using Obj Command (ja)
- Official Documentation: Object Handling in Unreal Engine (ja)
- 【UE5】Force Garbage Collection Operation (ja)
- 【UE4】About UObject's PendingKill | Hexadrive | Content Creation Company Focused on Game Production (ja)
- Official Documentation: Low-Level Memory Tracker (ja)
- [UE4] Memory Tracking Using LLM (Low-Level Memory Tracker) (ja)
- Official Documentation: Reference Viewer in Unreal Engine
- Video: How To Optimize Memory Usage In Your Unreal Engine 5 Game
- Qiita: Memory Tracking Using UE4 Memory Insights (ja)
- Official Documentation: Memory Insights in Unreal Engine (ja)
- Video: Maximizing Your Game's Performance in Unreal Engine | Unreal Fest 2022
- Hard References and Soft References (ja)
- How to Break BP Reference Chains (ja)
- About Texture Formats (ja)
- [UE5] Image Compression Formats (ja)
- Video: Optimizing Textures for Mobile in Unreal Engine 5
- Debugging and Memory Optimization (ja)
- Basic Settings for Mipmaps in UE5 (ja)